Taphorn, K., Busse, M., Brantl, J., Günther, B., Diaz, A., Holler, M., Dierolf, M., Mayr, D., Pfeiffer, F., & Herzen, J. (2022). X-ray Stain Localization with Near-Field Ptychographic Computed Tomography. Advanced science (Weinheim, Baden-Wurttemberg, Germany), 9(24), e2201723. https://doi.org/10.1002/advs.202201723
Purpose: Although X-ray contrast agents offer specific characteristics in terms of targeting and attenuation, their accumulation in the tissue on a cellular level is usually not known and difficult to access, as it requires high resolution and sensitivity. Here, quantitative near-field ptychographic X-ray computed tomography is demonstrated to assess the location of X-ray stains at a resolution sufficient to identify intracellular structures by means of a basis material decomposition. On the example of two different X-ray stains, the nonspecific iodine potassium iodide, and eosin Y, which mostly interacts with proteins and peptides in the cell cytoplasm, the distribution of the stains within the cells in murine kidney samples is assessed and compared to unstained samples with similar structural features. Quantitative nanoscopic stain concentrations are in good agreement with dual-energy micro computed tomography measurements, the state-of-the-art modality for material-selective imaging. The presented approach can be applied to a variety of X-ray stains advancing the development of X-ray contrast agents
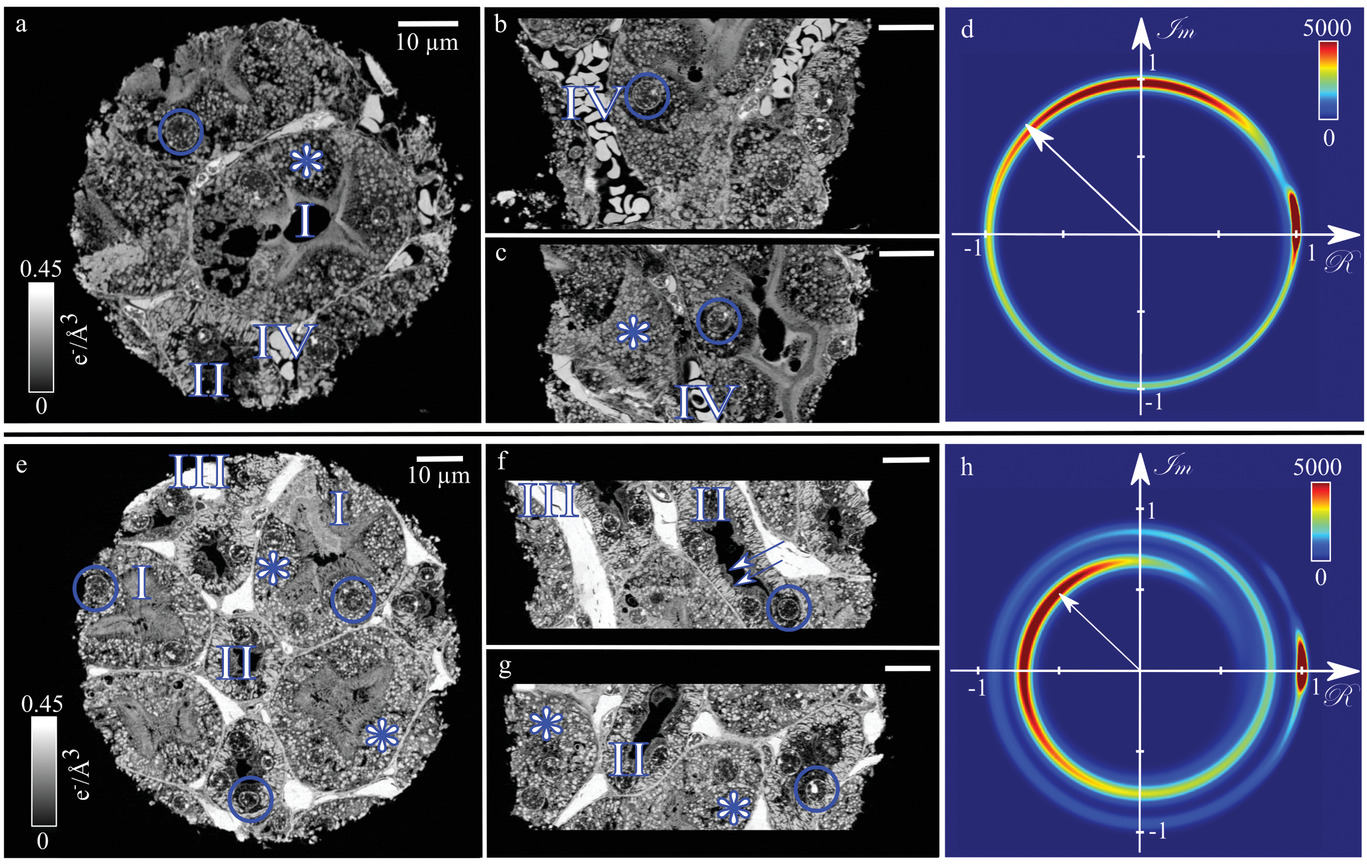
Figure: Comparison of unstained (top) and IKI-stained murine kidney piece (bottom). a–c) Orthogonal slices through the 3D reconstructed electron density. The colorbar in (a) applies to (b) and (c). d) 2D histogram (N = 325.4 × 10⁶) of the measured real and imaginary part of the transmission function (projection data) of the unstained sample. The vector from the origin to a specific point on the circle corresponds to the total transmission in the pixel, which depends among others on the sample thickness. The transmission is slightly below one. e–g) Murine kidney sample stained with IKI. The contrast is higher compared to the unstained sample (a–c). The colorbar in (e) applies to (f) and (g). h) The histogram (N = 350.1 × 10⁶) of the stained sample shows that the transmission is significantly decreased due to the X-ray stain (white vector). d,h) The peaks at (1+0i) correspond to the background (vacuum). All scalebars are 10 μm. Exemplified annotation: I: proximal tubules; II: distal tubules; III: blood capillaries; IV: erythrocytes; blue circles: cell nuclei; *: lysosomes; arrows in (f): basal striations.